

The bar chart IELTS format is common in Academic Writing Task 1. It requires candidates to identify key features, compare data, and report figures accurately. A strong response includes a clear overview, logical organization, relevant comparisons, appropriate vocabulary, and accurate grammar without adding personal opinions or unsupported claims.
A bar chart IELTS task presents numerical information using rectangular bars. The bars can be displayed vertically or horizontally, and they may represent different categories, places, groups, years, or percentages.
Bar charts can show:
- Changes over time
- Comparisons between different groups
- Differences between countries or locations
- Quantities or percentages
- Multiple categories in the same period
- Two or more sets of data
A chart may contain only a few categories or several groups that require careful comparison.
For example, a bar chart IELTS Task 1 question might compare the percentage of people using different forms of transportation in several cities. Another question could show the number of students studying different subjects at a university over several years.
The key is to understand what the chart measures before starting to write.
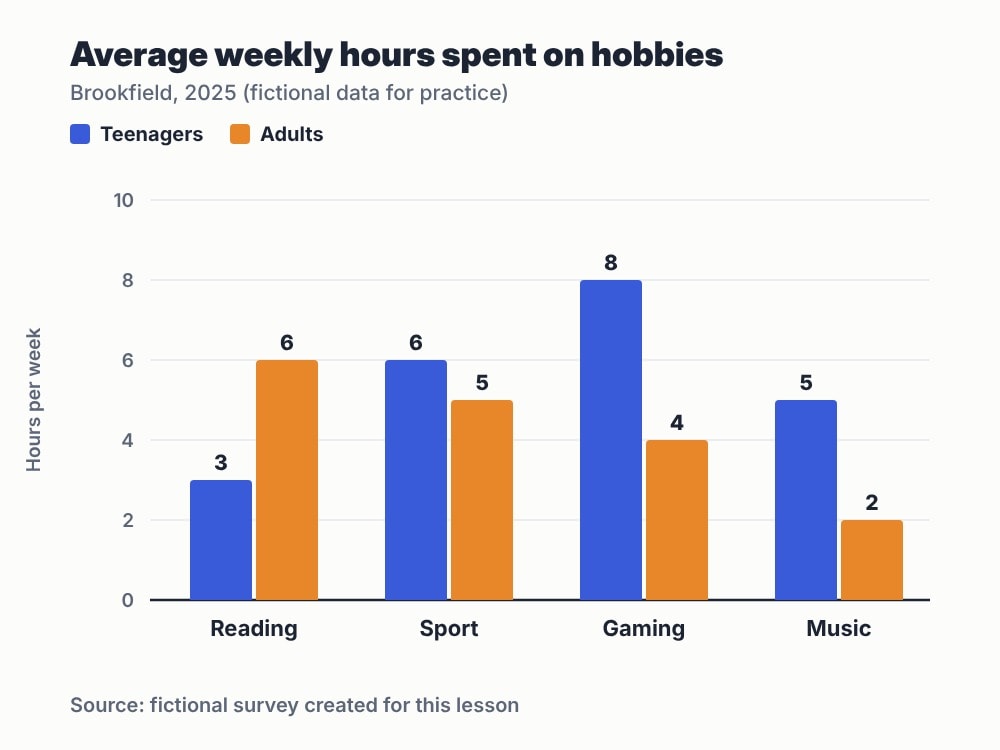
What Does IELTS Assess in Writing Task 1?
IELTS Writing Task 1 is assessed using four criteria:
- Task Achievement
- Coherence and Cohesion
- Lexical Resource
- Grammatical Range and Accuracy
Each criterion contributes equally to the Writing Task 1 score.
This means that a response with excellent vocabulary can still receive a lower score if it does not address the main features of the chart or contains serious problems with organization and grammar.
For a bar chart IELTS writing task 1 response, candidates should therefore focus on the complete set of assessment requirements rather than trying to impress the examiner with difficult vocabulary.
How Is the IELTS Overall Score Calculated?
IELTS provides separate scores for Listening, Reading, Writing, and Speaking. The overall band score is calculated by averaging the four component scores.
For example, if a candidate receives:
- Listening: 7.0
- Reading: 7.0
- Writing: 6.5
- Speaking: 7.0
The average is 6.875, which is reported as an overall 7.0.
The overall score is therefore not simply the Writing score. However, candidates applying to universities, professional organizations, or other institutions should check whether they have specific minimum requirements for individual skills.
How Long Should a Bar Chart IELTS Response Be?
IELTS Academic Writing Task 1 requires candidates to write at least 150 words.
There is no need to write an extremely long response. A well-organized answer of around 160–190 words can provide enough space to introduce the chart, present an overview, and explain the key details.
Writing more does not automatically mean achieving a higher band score. Quality, relevance, organization, and accuracy are more important than unnecessary length.

The Best Structure for Bar Chart IELTS Task 1
A clear structure makes it easier for the examiner to follow your response.
A practical structure consists of four paragraphs:
1. Introduction
Paraphrase the question using your own words.
For example:
The bar chart illustrates the percentage of households that owned different types of electronic devices in 2010 and 2020.
Avoid copying the question word for word.
2. Overview
The overview is one of the most important parts of a bar chart IELTS response.
Identify the most noticeable features without listing every figure.
For example:
Overall, ownership increased for most devices over the period, with smartphones experiencing the most significant growth.
A good overview usually focuses on major trends, the highest and lowest figures, significant differences, or notable changes.
3. Body Paragraph 1
Describe the first group of important information and support your statements with relevant figures.
Group similar categories together rather than describing the bars randomly.
4. Body Paragraph 2
Describe the remaining important information and make useful comparisons.
This structure helps prevent your answer from becoming a simple list of numbers.
How to Write an Effective Overview
Many candidates focus heavily on individual figures and forget to summarize the main picture.
For a bar chart IELTS Task 1 question, ask yourself:
- Which category is the highest?
- Which is the lowest?
- What increased significantly?
- What decreased?
- Which categories remained similar?
- Are there clear differences between groups?
- Are there any particularly noticeable exceptions?
The overview should not contain too many specific numbers. Save detailed figures for the body paragraphs.
For example, instead of writing:
The figure for Group A was 35%, while Group B was 42%.
An overview could say:
Overall, Group B recorded a higher proportion than Group A, while the remaining categories showed relatively similar results.
The body paragraphs can then provide the exact figures.
Useful Vocabulary for Bar Chart IELTS Writing
Vocabulary is important, but accuracy should always come first.
Language for increases
Useful expressions include:
- increase
- rise
- grow
- climb
- go up
- experience an increase
- show upward growth
Examples:
The percentage increased from 25% to 40%.
The figure for online shopping rose considerably during the period.
Language for decreases
You can use:
- decrease
- decline
- fall
- drop
- go down
- experience a reduction
Example:
The number of participants fell from 60 to 45.
Language for comparisons
Useful expressions include:
- higher than
- lower than
- similar to
- twice as high as
- considerably higher
- slightly lower
- approximately the same
- compared with
- respectively
For example:
The figure for public transport was considerably higher than that for private vehicles.
Language for stable figures
When figures do not change significantly, use:
- remain stable
- remain unchanged
- stay constant
- show little change
- remain relatively similar
Example:
The percentage remained relatively stable throughout the period.
How to Compare Data Effectively
A common weakness in bar chart IELTS writing task 1 responses is describing every bar separately.
Consider this example:
In 2010, Company A sold 20 units. Company B sold 30 units. Company C sold 40 units.
This is grammatically correct, but it does not make the relationship between the figures particularly clear.
A stronger approach would be:
Company C recorded the highest sales at 40 units, followed by Company B at 30, while Company A had the lowest figure, at 20.
This sentence combines information and creates a clear comparison.
You can also compare categories using ratios:
Sales of Product C were twice as high as those of Product A.
Only use such comparisons when the figures genuinely support them.
Bar Chart IELTS Sample Answer
Consider a hypothetical chart showing the percentage of adults who participated in four sports in 2010 and 2020.
A bar chart IELTS sample answer could look like this:
The bar chart compares the percentages of adults who participated in four different sports in 2010 and 2020.
Overall, participation increased in three of the four sports over the period. Running experienced the most noticeable growth, while swimming remained the least popular activity in both years.
In 2010, approximately 25% of adults participated in running, compared with 20% for cycling. By 2020, the figure for running had risen to around 40%, making it the most popular activity shown. Cycling also became more popular, increasing to approximately 30%.
Swimming accounted for about 15% of participation in 2010 and changed only slightly over the following decade. Meanwhile, participation in tennis increased from roughly 18% to 25%. Therefore, although running recorded the largest increase, swimming showed the smallest change among the four activities.
This bar chart IELTS sample demonstrates a clear introduction, overview, logical grouping, comparisons, and supporting figures.
Common Mistakes in Bar Chart IELTS Writing
Describing every number
You do not need to mention every figure. Select information that helps demonstrate the main patterns and comparisons.
Missing the overview
A response without a clear overview may fail to communicate the main features of the visual information.
Giving opinions
Task 1 is not an opinion essay. Avoid statements such as:
I think this trend is positive.
Instead, describe what the data shows.
Using inaccurate vocabulary
Do not describe a figure as “increasing” if it actually decreased. Similarly, do not call a small change “dramatic.”
The strength of your vocabulary should match the size of the change.
Using too many linking words
Expressions such as “however,” “therefore,” “moreover,” and “in addition” can be useful, but they should not appear in every sentence.
Use cohesive devices naturally.
Writing a memorized answer
A memorized template may not fit every chart. It is better to learn flexible structures and vocabulary that can be adapted to different questions.
How to Improve Your Bar Chart IELTS Writing
Start by practicing how to identify the main features before writing.
Spend a few minutes analyzing:
- What does the chart measure?
- What are the units?
- What period does it cover?
- Which categories have the highest and lowest values?
- What are the biggest increases or decreases?
- Which categories can be compared?
- What information can be grouped together?
Then create a simple outline before writing.
For example:
Introduction: What the chart shows
Overview: Two or three major features
Body 1: First important group
Body 2: Second important group
This approach can make your writing more organized and reduce the risk of including irrelevant information.
A Practical Study Plan for IELTS Writing Task 1
If you want to improve your bar chart IELTS performance, practice progressively.
Step 1: Learn the structure
Become comfortable with introduction, overview, and two body paragraphs.
Step 2: Build vocabulary
Learn expressions for increases, decreases, comparisons, stability, and approximate figures.
Step 3: Practice chart analysis
Look at a chart and identify the main features without writing a full response.
Step 4: Write under time pressure
Practice completing Task 1 within approximately 20 minutes.
Step 5: Review your mistakes
Check grammar, verb tense, articles, plurals, prepositions, comparisons, and numerical accuracy.
Step 6: Rewrite weak sentences
Do not simply move on after identifying mistakes. Rewrite incorrect sentences until the correct structure becomes familiar.
How Bar Chart IELTS Relates to Other IELTS Skills
Although a bar chart is specifically relevant to Academic Writing Task 1, preparing for IELTS requires balanced development across all four skills.
For Listening, practice understanding key information and recognizing paraphrases.
For Reading, develop skimming, scanning, vocabulary, and time-management skills.
For Writing, practice both Task 1 and Task 2 because they require different approaches.
For Speaking, focus on fluency, vocabulary, grammar, and pronunciation through spontaneous communication.
Improving one skill does not automatically guarantee the same improvement in another. A balanced study plan is therefore important.
Bar chart IELTS questions require candidates to summarize visual information clearly, identify key features, and make relevant comparisons. The most effective approach is not to describe every number but to organize the data logically and support important observations with accurate figures.
By studying bar chart IELTS task 1 structures, practicing bar chart IELTS writing task 1, and reviewing a strong bar chart IELTS sample, candidates can become more confident in analyzing different chart types. Focus on Task Achievement, organization, vocabulary, and grammatical accuracy, then apply the same disciplined approach to other IELTS Writing Task 1 questions.
Frequently Asked Questions (FAQs)
1. What is a bar chart in IELTS?
A bar chart is a visual format used in IELTS Academic Writing Task 1 to present numerical information. Candidates must summarize the main features and make relevant comparisons.
2. How many words should I write for Bar Chart IELTS Task 1?
You should write at least 150 words. A response of approximately 160–190 words is often sufficient when it clearly covers the identifying key features, making clear comparisons, organizing information logically, using appropriate vocabulary, and maintaining grammatical accuracy throughout your response. main features and relevant supporting details.
3. Do I need an overview in Bar Chart IELTS writing?
Yes, a clear overview is an important part of an effective Task 1 response. It should summarize the most noticeable features without describing every individual figure.
4. Can I give my opinion in a bar chart question?
No. IELTS Academic Writing Task 1 requires you to summarize the information presented in the chart. Personal opinions and unsupported explanations should generally be avoided.
5. How can a bar chart IELTS sample help me?
A good sample can help you understand paragraph organization, comparison language, vocabulary, and how to select important data. You should learn the techniques rather than memorize the complete answer.
6. How can I get a higher score in Bar Chart IELTS?
Focus on accurately identifying key features, making clear comparisons, organizing information logically, using appropriate vocabulary, and maintaining grammatical accuracy throughout your response.
Keywords:
Bar Chart IELTS Writing
Bar Chart IELTS Simon
Static Bar Chart IELTS
Dynamic Bar Chart IELTS
Stacked Bar Chart IELTS
Static Bar Chart IELTS Task 1
